Disclaimer
The information provided and experiments simulated here doesn't and is not intended to, constitute investment advice or research; instead, all information, content, and materials available are for general informational purposes only. The content may include inaccuracies and errors and all liability with respect to actions taken or not taken based on the contents are hereby expressly disclaimed.
On a personal note, extrapolation based on past performance, as done here, and I can't stress this enough, is no guarantee of future results. These are just mathematical models; projections not promises, however logical they may be.
TLDR
Analysis done here based on modelling randomized assortment/collective of fresh-issues and shouldn't be considered in the context of any individual fresh-issues. With that caveat:
IPOs are not worth it, at least for retail investors. Put your money elsewhere.
For more context read through the blog post. 🙂
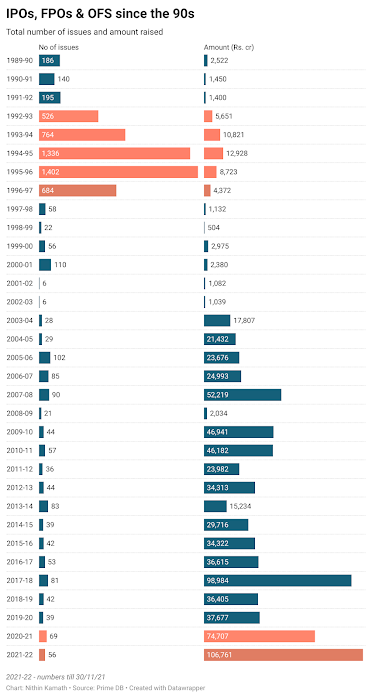
FY2021-22 has been a blockbuster year for IPOs so far. Even with some highly anticipated Q4 listings still to come, IPOs have raised more than 100,000 crores, i.e., 134 billion dollars, an insane amount of money, topping the last craze in 2017. This makes 2021, by far the costliest year in terms of average cost per share compared to other years.
That's an insane amount of capital raised from institutional, high net-worth and retail investors. Not to mention based on SEBI norms, retail investors need to be allotted at least 35% of the fresh issue. Coupled with the fact that many fresh issues earmark even higher proportions for retail category, an easy 35,000+ crores has been mobilized from the pockets of retail investors.
With the macros a bit dicey after the pandemic, the economic slowdown due to (necessary) lockdown, the supply-chain bottlenecks, the Fed tapering, the spill-over and inflation about to hit the roof, it's definitely the most insane year for the IPO market to be acting cuckoo. So why is this happening now and why are retail investors putting up so much money?
Let's try to answer the above questions in detail. But first some basics.
What's an IPO?
If you didn't know already, here's a TLDR version about IPOs: - For businesses, IPOs are a way to raise funds to finance their expenses, growth, interest or loan payments, etc. It comes under equity financing.
- For you and me, it's a lottery system, where we bid a price, wait for the allotment (fingers crossed), and get allotted a security whose intrinsic value may or may not be higher than what we paid for, i.e., it's not (usually) a bargain purchase.
For the long version, I recommend you read/skim the IPO Market's chapter in Zerodha Varsity. It has an excellent and down-to-earth explanation reg. IPOs and business in general. If you feel like it, drop this blog and jump to Varsity and read their articles. Can't recommend it enough!
Alright back on track....
Why are retail investors putting up so much money?
As reported by ET , "The market share of retail investors has risen sharply by 12 percentage points from 33 per cent in FY16 to 45 per cent in FY21, and in a recent release, NSE said it registered 51.3 lakh new investors in just four months of this financial year."
In another ET article, "Forty of the 58 IPOs are trading above the issue price. The average listing gain for those IPOs was 32 per cent compared with 44 per cent in 2020 and 19 per cent in 2019." 🤯
This indicates that a large collection of new-age tech-savvy investors are entering the capital markets in an unprecedented manner. With IPO applications made quick and easy and increased on-hands savings and eye-popping listing gains, many retail investors are whetting their risk-taking appetite in the primary markets, explaining the huge run-up so far.
However, recent fallouts from highly-criticized listings has brought to public attention the dark side of IPOs, where over-valued issues lose money for their investors. Given the fact that a small percentage of IPOs do result in large listing gains, does this compensate investors for the risk taken, especially in unproven-fledgling companies.
Despite numerous articles, providing arguments for or against IPOs, none quantitatively justify their stance. In this post, we'll try to work out the math as best as possible to objectively quantify "Whether IPOs are worth it?" as a series of answers to the following questions: - How are lots allotted to retail investors?
- How to simulate retail investor experience?
- How to calculate returns?
- Should I hold or sell for listing gains?
- How long should I hold?
- What are the implications and possible caveats?
But before that....
Let's talk data
As usual the devil is in the details. To dig any further we need to create a dataset. Using some google-fu, coding and excel magic, we do just that and quickly whip up a dataset of IPOs in India since 2010.

Exhibit - 3. Latest data as of 15th Oct. 2021.
In addition to the already available information online (i.e., listing date, name, subscription rates, issue size, prices, etc.), we also add share prices for 3, 6, 12 and 36 months from listing date to test what time-scale of holding captures most value.
- Type: The data used for this experiment is from Mainboard NSE & BSE listings. The kind of issues that you and I get to quickly subscribe to using UPI-based ASBA process
- Timeline: The data timeline ranges from 1st Jan 2010 to 15th Oct 2021. This means some highly celebrated and some criticized new issues, like Nykaa, PolicyBazaar, PayTM and more are not included. But it's fair to say even with their exclusion, we've enough data points to model average retail experience. Think Paras!
- Missing and Anomalous Data: When we're working with data, we need to keep a couple of things in mind.
- Firstly, no data is inherently clean even when sourced from highly-reputable sources. Post correction, we're left with a cool 274 clean IPOs in the past 11-12 year history.
- Secondly, outliers in data can skew statistical hypotheses. However, stock market is one of extremes, so filtering data does more harm than good. We skip this.
With that let's start with the first question...
How are lots allotted to retail investors?
IPO allotment for retail investors works on a lottery system, to say the least. The lots are allotted on the basis of supply and demand, i.e., number of lots available vs amount of retail subscription, through computerized process. If issues are highly over-subscribed, our chances of landing one are very small and vice-versa.
- In cases of under-subscription (RII < = 1), you're allotted all the lots you applied for.
- In cases of over-subscription, the no. of lots allotted is as follows:
- Low over-subscription: You're allotted a single lot, followed by a proportionate allotment based on remaining lots and no. of lots subscribed.
- High-oversubscription: You're randomly allotted only a single lot, irrespective of the no. of lots subscribed.
Sadly, the computerized allotment procedure is only known to SEBI or the Stock Exchanges. The amount of retail participation is only indicated through RII. Further, there's no information provided on number of retail participants per IPO and distribution of no. of lots subscribed at an individual level.🙄
However, based on the above, allotment for a single lot can be reasonably modelled. Let's see how...
The under-subscription logic for single lot is pretty straightforward. However, with over-subscription it get's tricky, since RII is an aggregate demand index, it doesn't show us how many retail investors are interested, rather it shows interest in the following form :
(No. of Investors * Average no. of lots applied)/No. of lots available for retail issue
To simplify the allotment criteria we'll make the following assumption: average no. of lots applied is equal to 1. Therefore, the RII gives the ratio of retail interest per lot of issue available and the probability of allotment is equal to inverse of RII. This gives us the benefit of conservative estimation, since in reality the average no. of lots applied will be skewed greater than 1.
We further tweak, this formula for managing allotment for under-subscription, i.e., RII < 1, and low levels of over-subscription, i.e. 1<RII<2, to arrive at the following:
Minimum(1,1/Absolute(RII-1))
This ensures that we get:
- higher single lot allotment probability for lower levels of over-subscription,
- exponentially tapered allotment probability for higher-levels of over-subscription and,
- bounded undersubscription to max probability of allotment, i.e., 1.
Exhibit - 4. Probability of retail allotment for different values of RII.
How to simulate retail investor experience?
In fact, the "average" listing gains are not experienced by the "average" retail investor.
So how can we calculate returns experienced by an average retail investor? To do such a thing, we should be first able to simulate retail participation in the primary markets. The solution: Monte Carlo Simulations.
Not to geek out, but Monte Carlo simulations are highly useful statistical tool to help predict outcomes where we've random variables (simply put values we don't know ahead of time) involved. And in our case, these random variables are possible allotments to retail investors who applied.
Let's simulate the retail experience spectrum for 10,000 retail investors applying for one lot each based on the retail allotment logic derived above. Using the 274 filtered IPOs across 10,000 retail investors, we compute a matrix of possible allotments, i.e., 274x10000 in size. We also carefully assume that the probability of allotment has a uniform distribution, i.e., every retail participant has a valid application and has equal chance, no matter his previous history, for allotment since the computerized process is assumed to operate without bias.
Exhibit - 5. The graph shows us a distribution of possible number of allotments for the 10,000 investors simulated.
How to calculate returns?
So far we've covered how to simulate retail experience and retail allotment in-depth. Talk about mileage. Now onto what everyone actually cares for, those sweet-sweet returns!🤩
But in order to calculate returns, we need answers to some basic questions:
Who is the "average" retail investor?
In order to simulate an average investor's "luck" in the IPO market, we make the following reasonable assumptions about him:
- He doesn't know how to time the market.
- He doesn't know how to pick stocks or evaluate fresh issues.
Although a mix and match strategy is also applicable, our average investor doesn't have any idea regarding the markets and prefers to keep it simple. He either sells on listing date or holds each issue for the same fixed period of time before selling at the then price. Other than that we also assume our investor applies for all fresh issues, without missing a beat.
Though in real-terms this behaviour is far from average, it simplifies our assumptions while modelling returns from IPOs.
What kind of return rates to expect?
To answer this we need to introduce a benchmark to compare the returns, i.e., risk-free return. The term refers to the monies that you can earn on your investment with minimal or no risk. In our case, this comes out to 4.86%, adjusted for the yield rate in Q3 2021 (much conservative than the 10 year average of ~7.2%) and assuming similar default probability.
The implication for investors being, if you're about to take any risks, the return rate on your investments should exceed this benchmark.
What metric should be used to calculate return rates?IPOs, like mutual funds, involve multiple transactions for both listing and holding purposes. Usually it's not a good idea to measure such investments using the usual return metrics, such as CAGR or Absolute Returns. In such cases we tend to stick to XIRR in order to quantify the return rate.
That said, the calculation of XIRR for hodl-ing 💎🤲 is actually pretty straightforward. However, there's a catch when it comes to calculating XIRR for listing gains. Listing for gains actually correlates to trading, i.e., any positions opened on issue date are squared off within 15 days either when listed or when reverted on non-allotment. Since the positions are squared of quickly, you need a trading capital 💰 to get started. Naturally, this leads to the next question.
What is an "OK" capital requirement in case of listing for IPOs?
Since, SEBI mandates that each retail investor can only apply to 5 ongoing IPOs at the same time. We can assume an ample floating capital requirement will be close to 10x upper-limit of issue size for one lot, i.e. 1.5 Lakhs.

Exhibit - 6. Year-wise distribution of issue cost for a single lot. The upper limit for issue size for retail investors was 7500 from 2010 to 2012, and later revised to 15000 post that.
We further split this capital infusion into two: half in the beginning of 2010 and another half in the beginning of 2012 to accommodate the lower issue size during the first 2 years.

Exhibit - 7. Simulated capex requirement on a monthly basis for all IPOs. Capex (Rs.) on y-axis in log-scale and Month-Year on x-axis.
Although capital required can be conservatively estimated based on allotment probability, a margin of safety approach is taken. This allows us to offset losses from one IPO w/o impacting capital req. for the next one and maintain a healthy floating capital on a monthly basis as shown above.
Should I hold or sell for listing gains?
Taking the risk-free return rate as the benchmark and baking in the above assumptions, we are going to calculate the probability of beating the benchmark by modelling the XIRR return rate for our retail simulations. Using Kernel Density Estimation, we model XIRR at listing open, listing close and holding forever (last date in dataset). Fortunately we've the numbers to calculate the returns for each condition. 🎯
Note:
- We calculate the returns for an assortment of fresh issues for 10-11 years and not single issues, therefore the returns you see in the graph below are representative of this assortment (calculated based on the assumptions outlined above).
- We also assume that any return lower than bench-mark doesn't preserve purchasing power, i.e., doesn't hedge inflation and therefore such investments are risky (destroy wealth). (This is an alternate metric of risk compared to std. or beta).
Exhibit - 8. Return rate distribution on holding (forever), listing at open and close. Benchmark: Risk-free return rate indicated with dashed red line (--)
That's shocking 🤯.
Contrary to common belief, holding actually leads to an almost nil return-rate for IPOs with a narrow-margin of variation between -1 to 1 % for almost all investors,i.e., doesn't outright destroy wealth. However, adjusted for inflation, we see that holding any assortment of such fresh issues results in a loss of purchasing power with 100% probability.
Even more shocking is the negative return rate range on listing gains when traded at listing close price. At 87% probability of negative return, it outright destroys wealth 💀 and any assortment of fresh issues have 100% probability of loss of purchasing power when sold at listing close.
Comparatively and fortunately, trading at listing open price, has a higher return range with a neat 85% probability 👌 compared to benchmark and is almost always positive, for all the possible allotment cases computed based on listed assumptions.
From above, it's pretty evident that selling at listing open is much better proposition for the following reasons:
- Firstly, when compared to holding, the amount of capital (and guts required) for holding your investments until they either get delisted or forever is much higher than floating capital that we calculated.
- Secondly, listing open has a high probability of risk-free return with higher return rates compared to other outcomes.
- Thirdly, since profits are immediately realised, those in excess of the floating capital can be re-invested in fixed-income or equity instruments for even higher yields.
This makes listing open look like almost a sure-bet. Well almost....
The risk in selling at listing open comes in form of time.
Exhibit - 9. Trading timeline for stock on listing day.
SEBI provides a very short window of time (approx. 10-15 mins) to make bids at opening price on listing day. Missing this window puts you and me in the unknown territory, where market volatility can swing prices wildly between the circuit limits. With almost 60% of issues closing lower than their opening price and 45% closing lower than the issue price, trading your issues during the open session, has a high probability of destroying wealth with no guarantee of returns.
In essence, IPOs reward disciplined twitchy fingers the most with severe penalties for any slower courses of actions.
The implication being that you should sell at listing open as much as possible and exit with a clean profit/loss. But if you've missed the sale at listing open price, then don't panic sell at listing close (use GTT 🙂). Holding might result in a better outcome.
But how long? 🤔
How long should I hold?
At the risk of comparing oranges to apples, the experiment above captures a very polarized investor behaviour, i.e., twitchy trader vs patient investor. A more viable behaviour to model between the two extremes would be holding for shorter periods of time, i.e., between 3-12 months in the hopes for selling at a neat profit.
To understand what time-scale of holding captures the most value, we model XIRR for shorter holding periods, i.e., 3, 6, 12 and 36 months, on a per issue basis.
Exhibit - 10. Return rate distribution on holding 3 months, 6 months, 1 year and 3 years respectively. Benchmark: Risk-free return rate indicated with dashed red line (--)
The return-rate distributions for holding for shorter periods are bi-modal, resulting in an distribution of returns earned, with moderate to large pay-offs, un-evenly on invested capital.
Starting from shorter interval of 3 months, holding actually leads to a 50% probability of greater than risk-free return, with 6 months giving around 74%, 1 year being the best (with more stable returns) at 83% and 3 years the worst at 3% (still better than holding forever).
The higher returns for holding periods shorter than 1 year seem to make a case for momentum investing in IPOs. A 3-12 month waiting period before taking a final call on your shares seems to be reasonable inference. Post that holding any assortment of IPOs leads to dismal outcomes.
Note: The higher probability indicated here should be taken with a pinch of salt due to the severe bi-modality, at least for the 3 and 6 month period.
What are the implications and possible caveats?
Historically speaking, we see that listing at opening bell or holding your collection of IPOs up to 1 year from date of listing gives you the best possible returns with least risks assumed. Conversely, neither is it best to hold onto the issues forever nor is it wise to sell them hastily after missing the opening bell.
Exhibit - 11. Table containing risk measure (lower better) and probability of greater than risk-free returns (higher better).
Both listing and holding gains are contextual to the business cycle, therefore over shorter periods one might experience consecutive losses in the market before seeing it change. With that understood, we can summarize our findings to the following set of recommendations, albeit with some caveats separately tabled.
Listing :
- @ Open - Very risky, but worth it if you can keep the time and discipline of selling issues at opening bell.
- @ Close - Don't sell at end-of-day or hold for 3-12 months for recovering value; no guarantee though.
Holding :
- Shorter Periods, i.e., 3-12 months: Risky, most profitable (depends on where in market cycle; highly contextual)
- Longer Periods, i.e. 1+ years: No meaningful gain; doesn't preserve purchasing power.
Caveat Emptors
Though history has a way of repeating itself, it seldom does in the same way and the context changes every time. Therefore one of the biggest caveats is that extrapolating analysis based on past data and projecting future performance is a dangerous game, especially in capital markets.
Here's a link to Prof. Damodaran's blog which explains the role of data in market analysis and caveats associated.
With that out of the way, I'll list a bunch of caveats or assumption to validate when trying to extrapolate the results of this study.
- We calculate the returns for an assortment of fresh issues over a period of 10-11 years and not single issues, therefore the returns reported are representative of this assortment. The run-up in Indian stock market between 2010 - 2021 is unique insofar to the timeline and occurrence of events and the results tabulated might not replicate again in future with similar margins.
- In order to simplify calculation, we don't account for SEBI's restriction of 5 active IPO allotments, we keep applying for as many as there are. Considering such a restriction would heavily reduce the potential pool of allotments, especially during market run-ups, thereby leading to missed gains.
- Holding and listing have different capital requirements. In holding, our capital is locked in for a long period of time, whereas in listing, you see immediate capital returns. Therefore, absolute returns between the two can't be compared.
- SEBIs restrictions on the bank accounts, limits on active IPO applications and a host of other potential regulations can further reduce/alter the pool of available IPOs in the future.
- Being allotted more IPOs doesn't mean it leads to better returns. A variation of IPOs allotted with differing characteristics can produce similar profit margins.
- Since we're only looking at capital earned not taxes filed, we don't consider any taxes or surcharges in any scenario. However, allowing for tax implications can further reduce the viability of all the scenarios listed to the extent amplified by number of transactions.